


Introduction
Football as we know it is one game that brings many people together, especially the Fédération Internationale de Football Association (FIFA) world cup competition which brings individuals (both strangers and friends) together, it also brings nationals together to cheer their national teams and in some cases, the various regions tend to cheer countries from those regions even if their country was not represented. Indeed, football is a unifier. With that said, the third week has been hectic for almost everyone on the team coupled with celebrations and the holiday season around the corner. There were many challenges and inevitable distractions including the breaking down of a team member’s personal computer. Despite the many challenges, we were thrilled to take on this project and push it to a logical conclusion. Below are the details of our findings.
The Goal, Data Sourcing, and Tool Used
This project aimed to analyze FIFA world cup data from 1930 to the present. Our search lead us to Kaggle where we found various datasets, we, however, settled on a dataset that has information from 1930 to 2014 since it was complete and readily available to help us analyze our data based on our selected indicators. For the task for the week, Power BI was used for the analysis and visualization.
Data Cleaning and Transformation
The dataset required just little cleaning and was easy to work with. The major cleaning done involved the replacement of values when some values in a selected column were repeated in another form. For example, we had Germany and Germany FR which represented the same thing. For uniformity and ease of analysis, Germany FR was replaced with Germany. We also went ahead to transform the data to suit our goals.
Data that could be sorted directly by creating tables was noted while those that required special transformation were also noted.
➢ Duplication, Column Merging, and Appending of Files
Problem 1: We needed a file that merged the Home Teams and the Away Teams for easy analysis and visualization of:
• The number of Teams per world cup
• Number of Goals scored by the individual Team
Solution: The World Cup Matches file was duplicated twice and renamed Country_goals_home and *Country_goals_away.*For the First, all columns were removed except for the Year, Home Team Name, and Home Team Goals while for the latter, all columns were removed except for the Year, Away Team Name and Away Team Goals Column. Lastly, we renamed the column headings of each adjusted file was renamed to Year, Team, and Goals (to duplicate a file, right-click on the file and click on duplicate).
Next, both Files were joined to form a single file which was renamed Country Goals (To append two files in Power Query, select both files, click on the Home Tab, and select Append Queries as a New Query)
Also, to avoid unnecessary datasets showing on our power bi List, we hid the Duplicated Columns as they were just created as a means to an end called Country Goals (To Hide a query, Right Click and Uncheck Enable Load)
Problem 2: We needed a visualization for Countries that had won the World Cup such that it wouldn’t adjust with the Time Slicer since we wanted that every time anybody sees the dashboard, they could notice it immediately.
Solution: The World cup file was duplicated and renamed as World cup static. While creating our relationship, we ensured that the new file isn’t in any relationship with the others. Therefore, it doesn’t change with our time slicer.
Problem 3: We needed a Visualization that displays the match outcome home and away
Solution: We created a new column that merged the Home Team Name and the Away Team Name Together Separating both using “Vs” and renamed it Match Team. We repeated the same procedure for Home Team Goals and Away Team Goals and renamed Match Outcome.
Required Insights
The First thing we did after cleaning was to ensure we knew the insights we wanted to visualize. We, therefore, worked with a list for that purpose.
Here is the List:
a. Number of World cup winning titles
b. World Cup attendance
c. Number of Teams
d. Total World Cup Goals
e. Goals per Team per World Cup
f. Matches with the Highest attendance
g. Stadium with the Highest Average Attendance
h. Which Countries had won the World Cup
i. Number of Goals per Country
j. Match Outcome Home and away
Main Slicer Identification
Time was taken to observe the datasets and understood what each column represented. A conclusion was made on what Column will be the major Slicer for the Visualization. After careful consideration, World Cup Year was selected to be the major Slicer for Visualisation.
Creation of Relationships
The World cup File had a Distinct date; therefore, Power BI created the relationship automatically but for the case of the World cup static file, the relationship was deleted to make it static.
Data Visualization
1. Creation of Tables
For each visualization to be displayed, a table was first created to ensure it correctly depicts our expectations. See the figure below for the tables created.
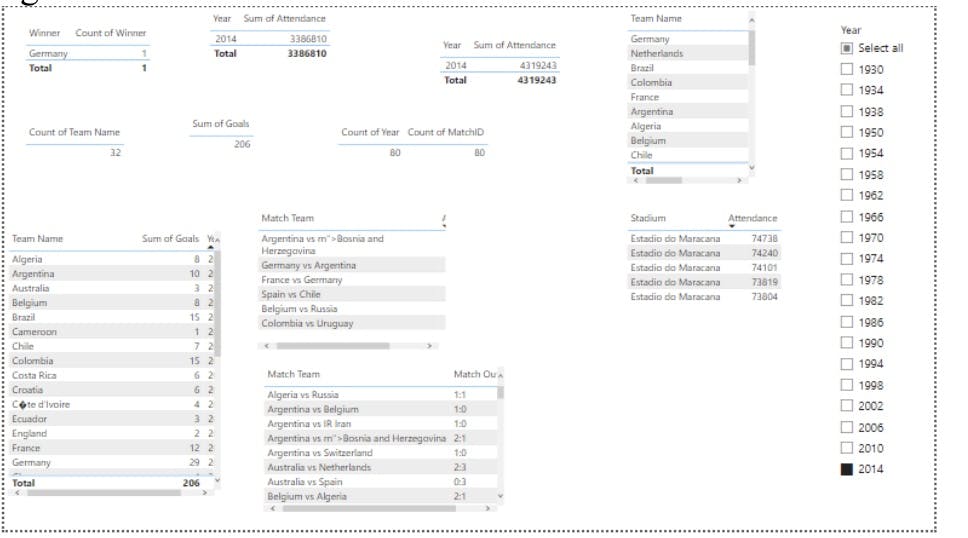
Figure 1: Tables
2. Selection of Appropriate charts
The Page for the Tables was duplicated and renamed as a Visualization page. On this page, the created tables were converted to charts.
3. Arrangements of Charts
Time was taken to carefully arrange the created charts on the Power BI canvas such that it tells a story and is immediately based on slicer selection.
4. Selection of Borders, Fonts, and Colours
It is not enough to tell a story. Colors, fonts, and lots more that make the Dashboard beautiful were included. Below is our final dashboard look.
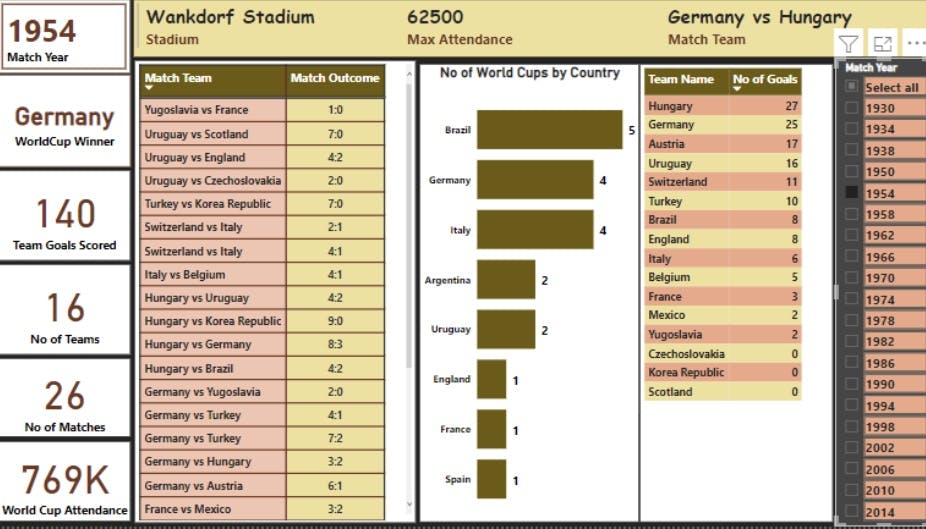
Figure 2: Final Dashboard
Insights From Data
Within 84 Years at an interval of 4 years, the world cup has been played a total of 20 times. Brazil is noted to be the highest winner of the World cup having won 5 times followed by Germany and Italy who won 4 times each while others include Argentina, Uruguay, England, France, and Spain. A total of 852 Matches and 81 Teams has been played in the world cup from 1930 to 2014. The total goals scored within this period and the summed-up World cup attendance is 2414 goals and with about 38 million attendance respectively. Over the years, Germany is noted to be the Highest goal scorer followed by Brazil and Argentina with 240, 225, and 133 goals respectively. Amongst the Matches played, the match between Argentina and Belgium had the highest attendance of 346,602 attendees. In addition, the stadium with the highest total attendance is Estadio Azteca with almost 1.92 million attendees and 19 Matches were played there.
Meet The Team
Oluwabankole Ojo
Victory Akiotu
Yusra Suleiman
Mary Thomas
Lois Keh
Amazino Robinson
Mubarak Oyekola
References
Link to Selected Dataset:kaggle.com/datasets/abecklas/fifa-world-cup..